Dollar Correlation Breaks Down — and Why That Matters Now
Maayo 1, 2026
Weli kuma jiro Af-Soomaali. Waxaa la tusayaa nuqulka Ingiriisiga.

Gold’s inverse relationship with the U.S. dollar is one of the most familiar rules of thumb in the market.
It is also one of the easiest to misuse.
The idea is simple enough: when the dollar strengthens, gold tends to struggle; when the dollar weakens, gold tends to find support. That relationship is real, but it is not fixed. At times it is one of the dominant drivers of gold. At other times it fades into the background while other forces — real yields, deleveraging, risk sentiment or official-sector demand — take control.
The last four months offer a good example of both regimes.
From January through April, the broad relationship between gold and the dollar still looked inverse overall. But under the surface, the relationship changed sharply. In March, the day-to-day correlation between gold and the dollar weakened almost to zero. In April, it snapped back and became strongly negative again.
That shift matters more than the rule itself.
The problem with the standard rule
The simplest version of the gold–dollar relationship is familiar:
dollar up, gold down; dollar down, gold up.
That framework works often enough to be useful, but not often enough to be trusted blindly.
There are two reasons.
First, gold is not responding only to the dollar. It is also responding to real yields, liquidity conditions, positioning, ETF flows, physical demand and central-bank activity.
Second, even when the dollar matters, the relationship can change depending on the type of market regime in place. A steady macro repricing behaves differently from a forced liquidation. A safe-haven bid behaves differently from a rates-driven selloff. A month-end comparison can also hide what is happening inside the month.
That is exactly what the recent data show.
The broad picture still looks inverse
The first chart makes the long-window relationship easy to see.
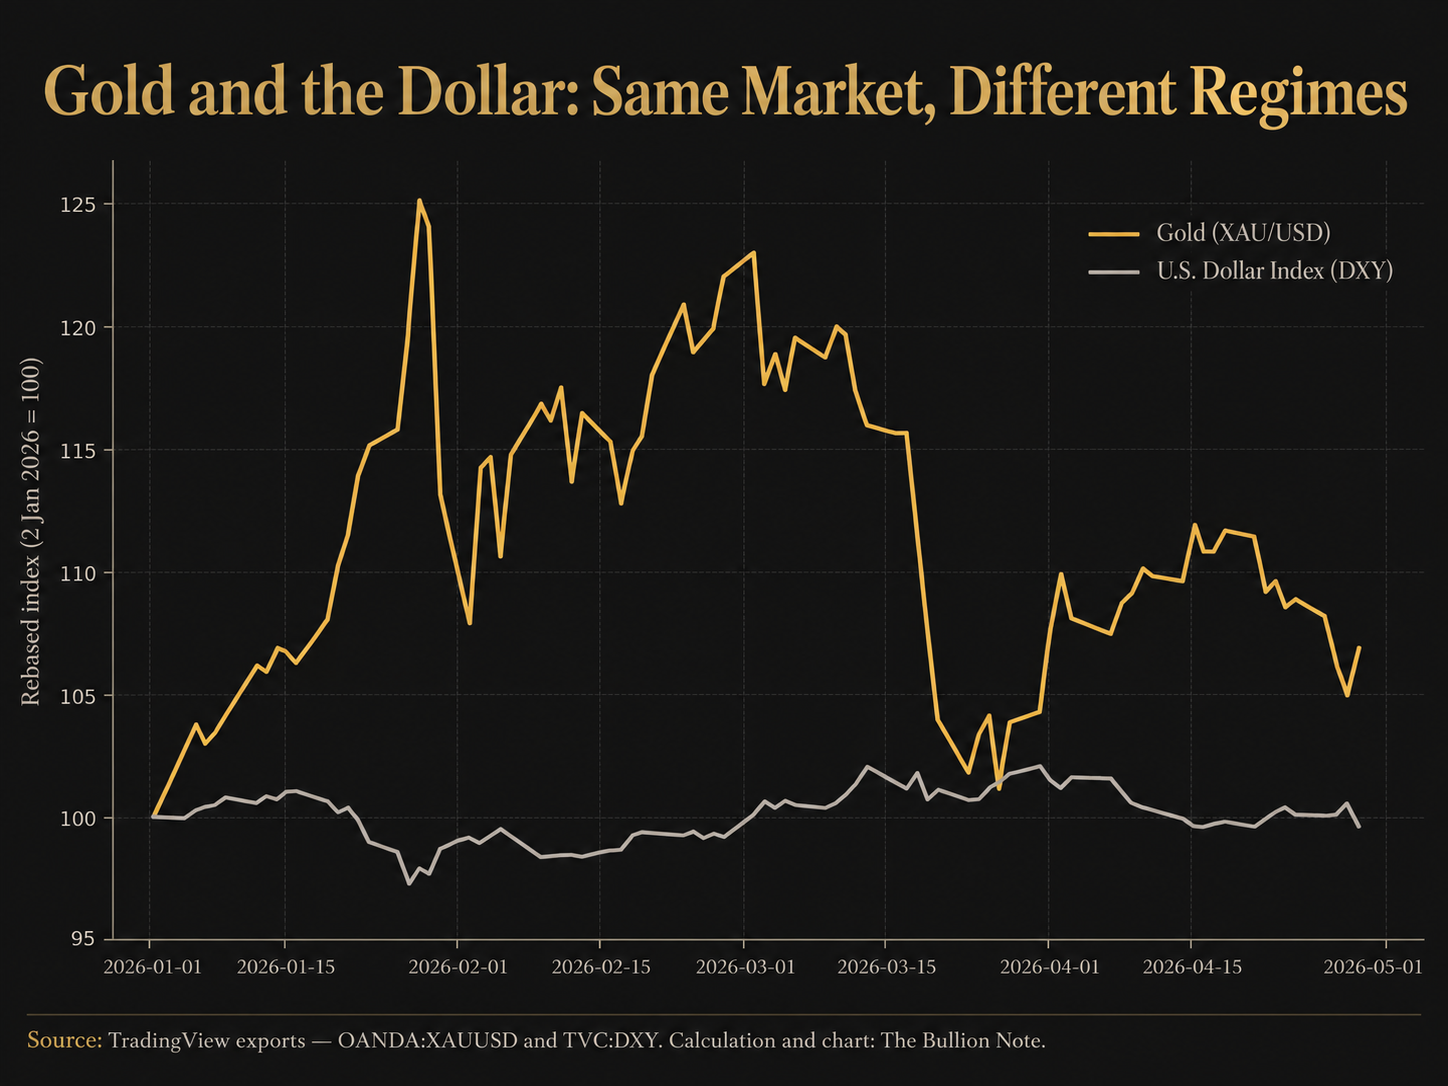
From early January through the end of April, gold and the dollar still moved broadly in opposite directions. Gold surged into late February, then collapsed in March, before partially recovering in April. The dollar, by contrast, firmed through the March shock and then softened again into April.
At first glance, that looks close to the textbook relationship.
But a price chart alone can be misleading.
A chart of endpoints can show two assets finishing in opposite directions without telling us whether they were actually moving inversely on a daily basis inside the period. For that, we need correlation.
March was the real breakdown
This is the key result.
Using the TradingView daily data you exported, the correlation of daily log returns between gold and DXY was approximately:
January: -0.50
February: -0.29
March: -0.15
April: -0.72
That makes March the outlier.
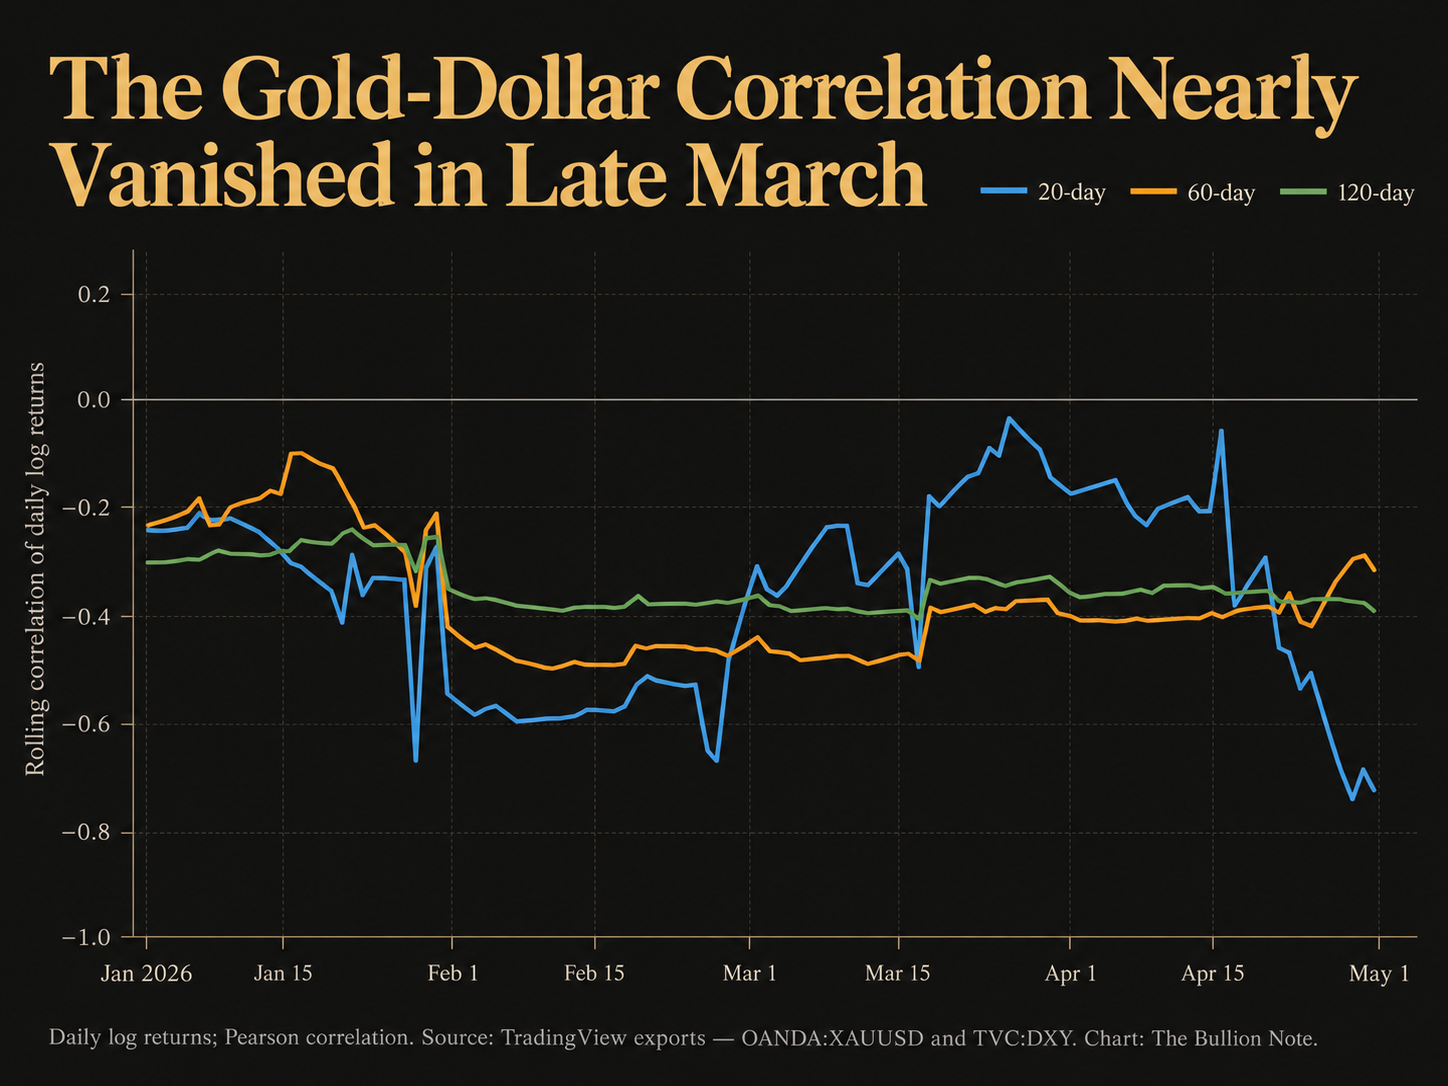
March finished with what looked like a textbook macro outcome. Gold fell sharply over the month while the dollar rose. On the surface, that seems like strong confirmation of the usual inverse relationship.
But the daily data show something else.
Inside March, the relationship was weak. The monthly endpoint looked inverse, but the day-to-day co-movement was not especially strong. The market arrived at a familiar destination through a much messier path.
That is exactly the kind of situation in which a simple rule of thumb becomes misleading.
The rolling correlation shows the regime change clearly
The rolling-correlation chart makes the transition even clearer.
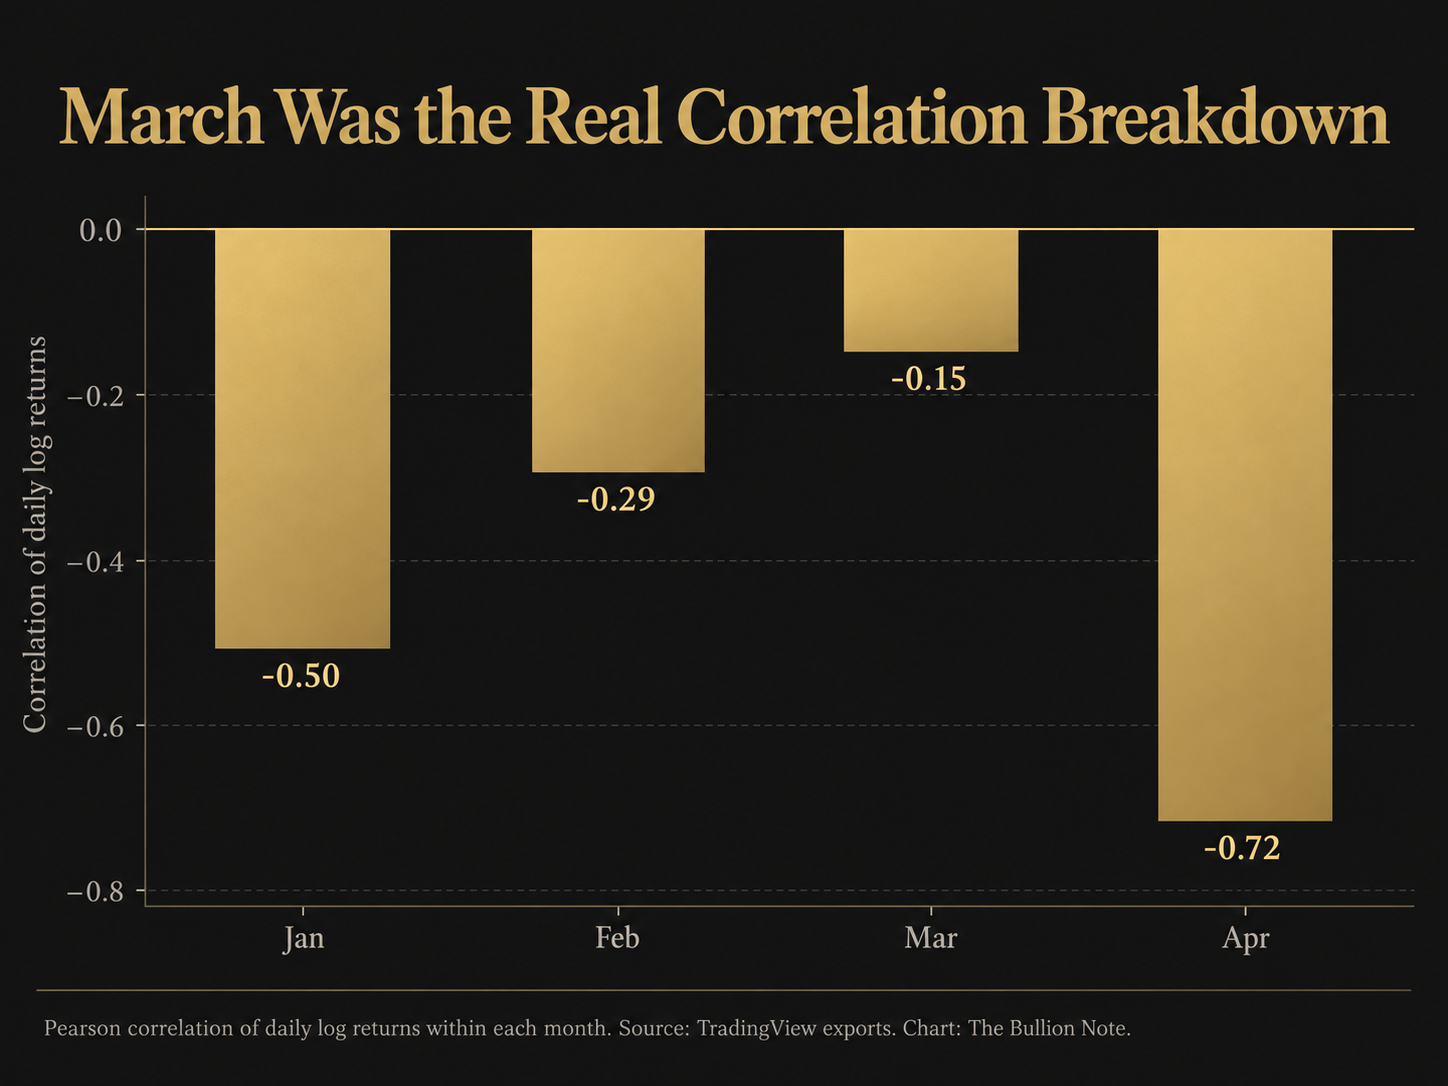
The 20-day rolling correlation between gold and DXY weakened steadily through March and reached roughly -0.03 on March 27 — effectively no short-term inverse relationship at all.
That is the breakdown.
The 60-day and 120-day measures also weakened, though less dramatically. That tells us the short-term trading regime changed first, while the broader medium-term relationship eroded more slowly.
Then April reversed the move.
By April 30, the 20-day correlation had recovered to roughly -0.73, while the 60-day and 120-day measures stood near -0.32 and -0.39 respectively.
In other words, the dollar’s short-term grip on gold weakened almost completely during the March liquidation, then reasserted itself forcefully in April.
That is a much better story than simply saying the correlation “broke down.”
It broke down, and then it came back.
Why March behaved differently
March was not a standard macro month.
It was a liquidation month.
That distinction matters.
In a conventional rates-driven environment, gold and the dollar often behave in a relatively orderly inverse pattern. Investors reprice expected policy, the dollar adjusts, real yields adjust, and gold responds through the opportunity-cost channel.
March was more chaotic.
The selloff in gold reflected more than a stronger dollar. It also bore the marks of deleveraging, futures unwinds, ETF outflows and broader pressure on positioning. In that kind of environment, assets can be sold not because their long-term thesis has changed, but because liquidity is suddenly more valuable than conviction.
That weakens the explanatory power of the dollar.
Gold can still finish the month lower while the dollar finishes it higher, but the path between those endpoints no longer reflects a clean, stable inverse relationship.
The daily correlation data picked that up immediately.
Why April matters just as much
April is important for the opposite reason.
If you only looked at month-end performance, you might think the relationship had stayed distorted. Gold and the dollar both finished lower in April, which could look like another breakdown.
But again, the daily data tell a different story.
April’s daily correlation was roughly -0.72, by far the strongest inverse month in the sample.
So although both assets ended the month lower, their day-to-day movements were strongly opposed. The usual inverse relationship had reasserted itself even though the monthly endpoints made the picture look less straightforward.
That is a crucial analytical point.
Monthly direction and daily correlation are not the same thing.
A strategist relying only on endpoint returns would miss the fact that April was actually a month in which the dollar mattered a great deal.
Correlation is a regime variable
This is the deeper lesson.
The gold–dollar relationship should not be treated as a constant. It is better understood as a regime variable.
At times, the dollar is a dominant explanatory factor.
At other times, gold is responding more to:
real yields,
changes in liquidity conditions,
ETF and futures flows,
safe-haven demand,
physical demand,
or official-sector activity.
That means the important question is not just “what is DXY doing?”
It is:
“How much of gold’s current move is the dollar actually explaining?”
When the correlation is strongly negative, the dollar is probably doing a lot of work.
When the correlation moves toward zero, some other force is taking over.
That transition can be more informative than the direction of the dollar itself.
The horizon matters too
Another useful point from the data is that the answer depends on the time horizon.
By the end of April:
the 20-day correlation was strongly negative,
the 60-day correlation was only moderately negative,
the 120-day correlation was weaker still.
That tells us the short-term inverse relationship had recovered much more forcefully than the medium-term one.
So even when the relationship “returns,” it may not return equally across all horizons.
That matters for interpretation.
A short-term trader and a macro allocator can both be looking at the same two assets and arrive at different but valid conclusions, simply because they are measuring different windows.
What the market is telling us now
The practical takeaway is not that the gold–dollar relationship is broken.
It is that the relationship is conditional.
The March liquidation showed that the dollar can lose explanatory power when markets shift into a more disorderly phase dominated by deleveraging and forced repositioning.
April showed that the relationship can return quickly once the market moves back toward a more conventional macro regime.
That means the most useful thing to monitor is not just the level of DXY, but the correlation itself.
When the correlation is stable and strongly negative, the usual framework is working.
When it weakens sharply, the market is signalling that some other variable has become more important.
That is often where the better information lies.
The takeaway
Gold’s inverse relationship with the U.S. dollar remains one of the market’s most useful heuristics.
It just is not a permanent law.
The TradingView data from January through April show a much more nuanced picture. The relationship held broadly in aggregate, but nearly disappeared during the March liquidation, when the 20-day rolling correlation briefly fell to around zero. In April, it returned sharply, with daily gold and dollar moves once again strongly inverse.
So the right conclusion is not that the rule failed.
It is that the rule became temporarily less relevant.
That distinction matters.
Because when a familiar relationship weakens, the correct response is not to force the old explanation onto the market. It is to ask what has replaced it.
That is usually where the real signal begins.